SuperTrend Oscillator v3Version 3: Improved aesthetically, complete turnaround for the strategy with which to use this indicator.
Once again, thanks to BlindFreddy and ChrisMoody for the bits of code that were assembled into this indicator.
Make the chart yours using the share button for the indicator with barcolors functionality.
Changes from v2 and looking forward: Indicator now uses a 14 length SuperTrend with no ATR multiplier. This my preferred use and I'd be grateful to hear your case for a different length/multiplier. Removed the Bollinger Bands and retracement dots due to these being gimmicky and marginally useful. There may be a version 4 should a similar concept using a rate of change analysis turn out to be useful. I have also tried -in vain- to plot internal trend peaks as horizontal S/R levels. Please pm if you are willing to help in that respect.
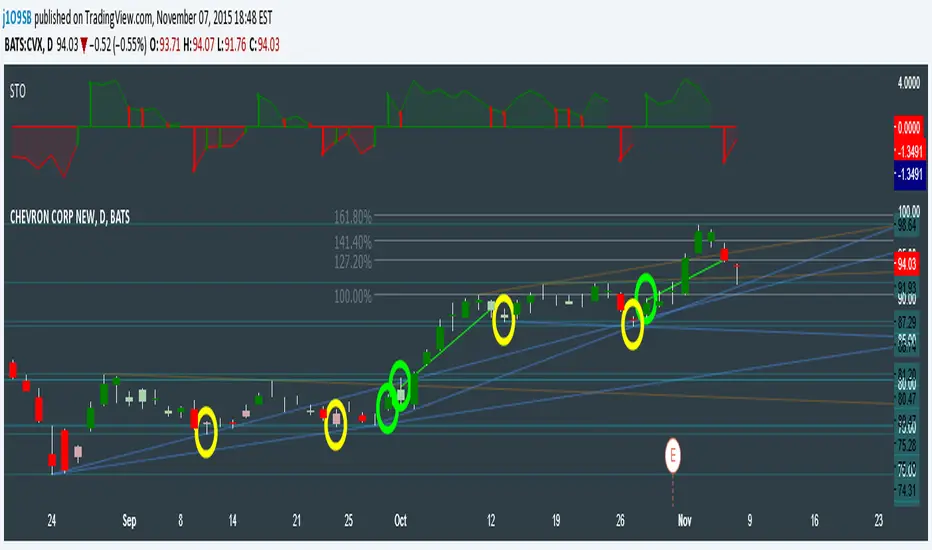
Strategy: The indicator will display the trend as a red/green area. It measures the spread between the closing price and the SuperTrend line, much like a CCI (close and ma). When the area contracts warning bars of the opposite trend color will warn of a reversal. When this happens, these areas will either be defended, reviving the trend, or will break, causing a trend flip. SuperTrend is unique in that breaks are typically large candles, and that its levels, especially on Weekly, Daily, Hourly, Minute timeframes, these levels will be defended (think similar to a 200sma or a 21ema). The STO making new highs within (internal) a trend is an overextension sign.
CVX Example: This is not a full analysis of CVX's stock , just an example potential trades. On the posted chart I used a weekly and a daily STO.
Long 1:The weekly showed warnings and then flipped. The daily made a double bottom, showed warnings and then flipped the daily STO at trendline support.
Long 2:The weekly still shows an uptrend, the daily made a weak break to downtrend and reversed back upwards at trendline support, forming a double bottom. Note the conservative exit when the STO made an internal new high.
Long 3: looking forward on CVX stock , the current downtrend made a weak break and is showing sings of reversal (pin bar) at horizontal support. Go long on flip of the daily (conservative) or flip of the hourly (aggressive).
Cerca negli script per "the strat"
SuperTrend OscillatorVersion 3: Improved aesthetically, complete turnaround for the strategy with which to use this indicator.
Once again, thanks to BlindFreddy and ChrisMoody for the bits of code that were assembled into this indicator.
Make the chart yours using the share button for the indicator with barcolors functionality.
Changes from v2 and looking forward: Indicator now uses a 14 length SuperTrend with no ATR multiplier. This my preferred use and I'd be grateful to hear your case for a different length/multiplier. Removed the Bollinger Bands and retracement dots due to these being gimmicky and marginally useful. There may be a version 4 should a similar concept using a rate of change analysis turn out to be useful. I have also tried -in vain- to plot internal trend peaks as horizontal S/R levels. Please pm if you are willing to help in that respect.
Strategy: The indicator will display the trend as a red/green area. It measures the spread between the closing price and the SuperTrend line, much like a CCI (close and ma). When the area contracts warning bars of the opposite trend color will warn of a reversal. When this happens, these areas will either be defended, reviving the trend, or will break, causing a trend flip. SuperTrend is unique in that breaks are typically large candles, and that its levels, especially on Weekly, Daily, Hourly, Minute timeframes, these levels will be defended (think similar to a 200sma or a 21ema). The STO making new highs within (internal) a trend is an overextension sign.
CVX Example: This is not a full analysis of CVX's stock, just an example potential trades. On the posted chart I used a weekly and a daily STO.
Long 1:The weekly showed warnings and then flipped. The daily made a double bottom, showed warnings and then flipped the daily STO at trendline support.
Long 2:The weekly still shows an uptrend, the daily made a weak break to downtrend and reversed back upwards at trendline support, forming a double bottom. Note the conservative exit when the STO made an internal new high.
Long 3: looking forward on CVX stock, the current downtrend made a weak break and is showing sings of reversal (pin bar) at horizontal support. Go long on flip of the daily (conservative) or flip of the hourly (aggressive).

CM Stochastic POP Method 2-Jake Bernstein_V1Yesterday Jake Bernstein authorized me to post his updated results with the Stochastic Pop Trading System he developed many years ago.
You can take a look at the Original System with Updated Settings at
This indicator is a different set of rules Jake mentioned in the PDF he allowed me to post.
To view the PDF use this link:
dl.dropboxusercontent.com
Today we’re releasing the version described in the PDF that uses the StochK values of 55, 50, and 45. The rules are discussed in the PDF but here is a simple breakdown:
Enter Long when StochK is below 50 and Crosses Above 55
Exit Long on Cross Below 55
Enter Short when StochK is Above 50 and crosses Below 45
Exit Short on Cross Above 45
Two Important Items to understand about this method:
To code the rules Precisely we need a function that will be available when Strategy Capabilities are released on TradingView.
There is one of Jakes Profit Maximizing Strategies that needs to be integrated with this code…which again we need the Strategy based Function that will be coming soon.
To Compare this system to the Stochastic Pop Method 1 System shown yesterday at I used the same Symbol and dates for you to compare…but remember to give this Method 2 System a Fair Look/Evaluation…we need the Soon To Be Released…TradingView Strategy Capabilities.
BackTesting Results Example: EUR-USD Daily Chart Since 01/01/2005
Strategy 1 – Stochastic Pop Method 2 System:
Go Long When Stochasticis below 50 and Crosses Above 55. Go Short When Stochastic is above 50 and Crosses Below 45. Exit Long/Short When Stochastic has a Reverse Cross of Entry Value.
Results:
Total Trades = 151
Profit = 40,758 Pips
Win% = 37.1%
Profit Factor = 1.26
Avg Trade = 270 Pips Profit
***Most Consecutive Wins = 4 ... Most Consecutive Losses = 7
Strategy 2:
Rules - Proprietary Optimization Jake Will Teach. Only Added 1 Additional Exit Rule.
Results:
Total Trades = 151
Profit = 60.305 Pips
Win% = 37.1%
Profit Factor = 1.38
Avg Trade = 399 Pips Profit
***Most Consecutive Wins = 4 ... Most Consecutive Losses = 7
Indicator Includes:
-Ability to Color Candles (CheckBox In Inputs Tab)
Green = Long Trade
Blue = No Trade
Red = Short Trade
Jake Bernstein will be a contributor on TradingView when Backtesting/Strategies are released. Jake is one of the Top Trading System Developers in the world with 45+ years experience and he is going to teach TradingView.com’s community how to create Trading Systems and how to Optimize the correct way.
Link To PDF:
dl.dropboxusercontent.com
Link to Original Version of Indicator with Updated Settings.

UCS_S_Steve Primo - Strategy #5 (FOREX Only)Here we have another Steve Primo Strategy ( #5)
This is a short term, trend continuation strategy, Recommend using this on 30 Mins + time frames.
I have added few things.
1. PET-D filter, to identify the trend along with the SMA 50. ----> Setup in line with PET-D (EMA,15) trend confirmation.
2. Option for Harami Candle identification (may not be Steve Primo Setup), There is no evidence on any of the videos listed below for Harami or other candlesticks pattern.
Future - Planned to add other candle patterns.
Videos from Youtube
1. www.youtube.com -
2. www.youtube.com - Hints disclosed on this video.
3. www.youtube.com - Claims this is his GO TO strategy for FOREX.
4. www.youtube.com - Complete Free Lesson.
Note - I did not buy this Strategy, I do not own in any way shape or form of this strategy as presented in the videos, The Strategy I am posting is my interpretation based on Steve Primo's videos listed above and few more on youtube.
Good Luck folks.

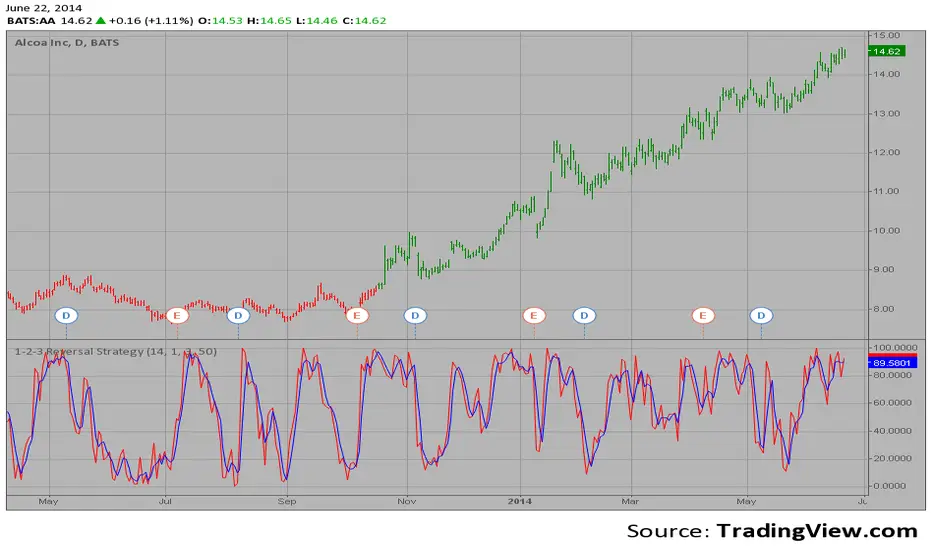
1-2-3 Reversal Strategy This System was created from the Book "How I Tripled My Money In The
Futures Market" by Ulf Jensen, Page 183. This is reverse type of strategies.
The strategy buys at market, if close price is higher than the previous close
during 2 days and the meaning of 9-days Stochastic Slow Oscillator is lower than 50.
The strategy sells at market, if close price is lower than the previous close price
during 2 days and the meaning of 9-days Stochastic Fast Oscillator is higher than 50.
UK100 London Judas & IFVG SetupUK100 London Judas & IFVG Setup
Overview This indicator is a specialized trading tool designed to automate the ICT Judas Swing strategy specifically for the UK100 (FTSE 100) index during the London Market Open. It combines institutional time-based logic with price action confirmation using Inversion Fair Value Gaps (IFVG) to identify high-probability reversal setups.
How It Works The strategy is based on the concept that the initial move after the London Open is often a "fake-out" (manipulation) designed to trap retail traders and engineer liquidity before the true trend of the day begins.
Session & Opening Price:
The script marks the London Open price (default 09:00 Warsaw / 08:00 London time) with a dashed line.
This serves as the "line in the sand." Prices moving away from this line initially are monitored for manipulation.
Judas Swing (Liquidity Sweep):
If price moves BELOW the open, it is hunting Sell-Side Liquidity (trapping sellers).
If price moves ABOVE the open, it is hunting Buy-Side Liquidity (trapping buyers).
The Entry Trigger: Inversion FVG (IFVG):
The indicator scans for Fair Value Gaps (FVG) created during the manipulation phase.
BUY Signal: The price manipulates lower, creates a Bearish FVG (Red Box), but then aggressively reverses and closes ABOVE that gap. The gap is now "Inverted" (turns Green), acting as support.
SELL Signal: The price manipulates higher, creates a Bullish FVG (Green Box), but then aggressively reverses and closes BELOW that gap. The gap is now "Inverted" (turns Orange), acting as resistance.
Key Features
Automated Pattern Recognition: No need to manually draw gaps. The script detects valid FVG inversions that align with the Judas Swing logic.
Built-in Risk Calculator: The signal labels display the exact Lot Size you should use based on your account balance and risk percentage (default 0.5%). It calculates this dynamically based on the Stop Loss distance.
Institutional Targets: The indicator fetches H1 Fractals (Liquidity) from the 1-hour timeframe and plots them on your 1-minute chart as blue lines. These are your primary Take Profit (TP) levels.
Stop Loss Visualization: Automatically suggests a Stop Loss placement behind the swing high/low of the reversal structure.
How to Use
Timeframe: Set your chart to 1 Minute (1m).
Asset: UK100 (FTSE 100).
Wait: Allow the London session to open. Watch for price to move away from the opening line.
Execute: When a BUY or SELL label appears:
Enter the trade using the Lot Size shown on the label.
Set your Stop Loss at the price shown on the label.
Target the blue H1 Liquidity lines for profit taking.
Settings
Timezone: Set this to your chart/exchange timezone (Default: Europe/Warsaw).
Account Balance: Input your current trading capital (e.g., 100,000) for accurate risk calculations.
Risk Per Trade %: The percentage of your account you are willing to lose if the Stop Loss is hit (Standard: 0.5% - 1.0%).
Contract Size: The value of 1 point movement (Check your broker's specifications. Usually 1 for CFDs).
Alerts You can set a single alert in TradingView to capture all signals. Select the indicator and choose "Any alert() function call". You will receive a notification with the direction (Buy/Sell), Entry Price, and Lot Size.

Volatility Targeting: Single Asset [BackQuant]Volatility Targeting: Single Asset
An educational example that demonstrates how volatility targeting can scale exposure up or down on one symbol, then applies a simple EMA cross for long or short direction and a higher timeframe style regime filter to gate risk. It builds a synthetic equity curve and compares it to buy and hold and a benchmark.
Important disclaimer
This script is a concept and education example only . It is not a complete trading system and it is not meant for live execution. It does not model many real world constraints, and its equity curve is only a simplified simulation. If you want to trade any idea like this, you need a proper strategy() implementation, realistic execution assumptions, and robust backtesting with out of sample validation.
Single asset vs the full portfolio concept
This indicator is the single asset, long short version of the broader volatility targeted momentum portfolio concept. The original multi asset concept and full portfolio implementation is here:
That portfolio script is about allocating across multiple assets with a portfolio view. This script is intentionally simpler and focuses on one symbol so you can clearly see how volatility targeting behaves, how the scaling interacts with trend direction, and what an equity curve comparison looks like.
What this indicator is trying to demonstrate
Volatility targeting is a risk scaling framework. The core idea is simple:
If realized volatility is low relative to a target, you can scale position size up so the strategy behaves like it has a stable risk budget.
If realized volatility is high relative to a target, you scale down to avoid getting blown around by the market.
Instead of always being 1x long or 1x short, exposure becomes dynamic. This is often used in risk parity style systems, trend following overlays, and volatility controlled products.
This script combines that risk scaling with a simple trend direction model:
Fast and slow EMA cross determines whether the strategy is long or short.
A second, longer EMA cross acts as a regime filter that decides whether the system is ACTIVE or effectively in CASH.
An equity curve is built from the scaled returns so you can visualize how the framework behaves across regimes.
How the logic works step by step
1) Returns and simple momentum
The script uses log returns for the base return stream:
ret = log(price / price )
It also computes a simple momentum value:
mom = price / price - 1
In this version, momentum is mainly informational since the directional signal is the EMA cross. The lookback input is shared with volatility estimation to keep the concept compact.
2) Realized volatility estimation
Realized volatility is estimated as the standard deviation of returns over the lookback window, then annualized:
vol = stdev(ret, lookback) * sqrt(tradingdays)
The Trading Days/Year input controls annualization:
252 is typical for traditional markets.
365 is typical for crypto since it trades daily.
3) Volatility targeting multiplier
Once realized vol is estimated, the script computes a scaling factor that tries to push realized volatility toward the target:
volMult = targetVol / vol
This is then clamped into a reasonable range:
Minimum 0.1 so exposure never goes to zero just because vol spikes.
Maximum 5.0 so exposure is not allowed to lever infinitely during ultra low volatility periods.
This clamp is one of the most important “sanity rails” in any volatility targeted system. Without it, very low volatility regimes can create unrealistic leverage.
4) Scaled return stream
The per bar return used for the equity curve is the raw return multiplied by the volatility multiplier:
sr = ret * volMult
Think of this as the return you would have earned if you scaled exposure to match the volatility budget.
5) Long short direction via EMA cross
Direction is determined by a fast and slow EMA cross on price:
If fast EMA is above slow EMA, direction is long.
If fast EMA is below slow EMA, direction is short.
This produces dir as either +1 or -1. The scaled return stream is then signed by direction:
avgRet = dir * sr
So the strategy return is volatility targeted and directionally flipped depending on trend.
6) Regime filter: ACTIVE vs CASH
A second EMA pair acts as a top level regime filter:
If fast regime EMA is above slow regime EMA, the system is ACTIVE.
If fast regime EMA is below slow regime EMA, the system is considered CASH, meaning it does not compound equity.
This is designed to reduce participation in long bear phases or low quality environments, depending on how you set the regime lengths. By default it is a classic 50 and 200 EMA cross structure.
Important detail, the script applies regime_filter when compounding equity, meaning it uses the prior bar regime state to avoid ambiguous same bar updates.
7) Equity curve construction
The script builds a synthetic equity curve starting from Initial Capital after Start Date . Each bar:
If regime was ACTIVE on the previous bar, equity compounds by (1 + netRet).
If regime was CASH, equity stays flat.
Fees are modeled very simply as a per bar penalty on returns:
netRet = avgRet - (fee_rate * avgRet)
This is not realistic execution modeling, it is just a simple turnover penalty knob to show how friction can reduce compounded performance. Real backtesting should model trade based costs, spreads, funding, and slippage.
Benchmark and buy and hold comparison
The script pulls a benchmark symbol via request.security and builds a buy and hold equity curve starting from the same date and initial capital. The buy and hold curve is based on benchmark price appreciation, not the strategy’s asset price, so you can compare:
Strategy equity on the chart symbol.
Buy and hold equity for the selected benchmark instrument.
By default the benchmark is TVC:SPX, but you can set it to anything, for crypto you might set it to BTC, or a sector index, or a dominance proxy depending on your study.
What it plots
If enabled, the indicator plots:
Strategy Equity as a line, colored by recent direction of equity change, using Positive Equity Color and Negative Equity Color .
Buy and Hold Equity for the chosen benchmark as a line.
Optional labels that tag each curve on the right side of the chart.
This makes it easy to visually see when volatility targeting and regime gating change the shape of the equity curve relative to a simple passive hold.
Metrics table explained
If Show Metrics Table is enabled, a table is built and populated with common performance statistics based on the simulated daily returns of the strategy equity curve after the start date. These include:
Net Profit (%) total return relative to initial capital.
Max DD (%) maximum drawdown computed from equity peaks, stored over time.
Win Rate percent of positive return bars.
Annual Mean Returns (% p/y) mean daily return annualized.
Annual Stdev Returns (% p/y) volatility of daily returns annualized.
Variance of annualized returns.
Sortino Ratio annualized return divided by downside deviation, using negative return stdev.
Sharpe Ratio risk adjusted return using the risk free rate input.
Omega Ratio positive return sum divided by negative return sum.
Gain to Pain total return sum divided by absolute loss sum.
CAGR (% p/y) compounded annual growth rate based on time since start date.
Portfolio Alpha (% p/y) alpha versus benchmark using beta and the benchmark mean.
Portfolio Beta covariance of strategy returns with benchmark returns divided by benchmark variance.
Skewness of Returns actually the script computes a conditional value based on the lower 5 percent tail of returns, so it behaves more like a simple CVaR style tail loss estimate than classic skewness.
Important note, these are calculated from the synthetic equity stream in an indicator context. They are useful for concept exploration, but they are not a substitute for professional backtesting where trade timing, fills, funding, and leverage constraints are accurately represented.
How to interpret the system conceptually
Vol targeting effect
When volatility rises, volMult falls, so the strategy de risks and the equity curve typically becomes smoother. When volatility compresses, volMult rises, so the system takes more exposure and tries to maintain a stable risk budget.
This is why volatility targeting is often used as a “risk equalizer”, it can reduce the “biggest drawdowns happen only because vol expanded” problem, at the cost of potentially under participating in explosive upside if volatility rises during a trend.
Long short directional effect
Because direction is an EMA cross:
In strong trends, the direction stays stable and the scaled return stream compounds in that trend direction.
In choppy ranges, the EMA cross can flip and create whipsaws, which is where fees and regime filtering matter most.
Regime filter effect
The 50 and 200 style filter tries to:
Keep the system active in sustained up regimes.
Reduce exposure during long down regimes or extended weakness.
It will always be late at turning points, by design. It is a slow filter meant to reduce deep participation, not to catch bottoms.
Common applications
This script is mainly for understanding and research, but conceptually, volatility targeting overlays are used for:
Risk budgeting normalize risk so your exposure is not accidentally huge in high vol regimes.
System comparison see how a simple trend model behaves with and without vol scaling.
Parameter exploration test how target volatility, lookback length, and regime lengths change the shape of equity and drawdowns.
Framework building as a reference blueprint before implementing a proper strategy() version with trade based execution logic.
Tuning guidance
Lookback lower values react faster to vol shifts but can create unstable scaling, higher values smooth scaling but react slower to regime changes.
Target volatility higher targets increase exposure and drawdown potential, lower targets reduce exposure and usually lower drawdowns, but can under perform in strong trends.
Signal EMAs tighter EMAs increase trade frequency, wider EMAs reduce churn but react slower.
Regime EMAs slower regime filters reduce false toggles but will miss early trend transitions.
Fees if you crank this up you will see how sensitive higher turnover parameter sets are to friction.
Final note
This is a compact educational demonstration of a volatility targeted, long short single asset framework with a regime gate and a synthetic equity curve. If you want a production ready implementation, the correct next step is to convert this concept into a strategy() script, add realistic execution and cost modeling, test across multiple timeframes and market regimes, and validate out of sample before making any decision based on the results.

MACD-V Multi-Timeframe Confluence DashboardThis indicator identifies high-probability trade entries by analyzing momentum alignment across multiple timeframes using the MACD-V (Volatility Normalized MACD) formula. It features a fully customizable signal engine that allows traders to specify exactly which timeframes must agree before a trade signal is generated.
Optimized Defaults
By default, the indicator is tuned to the 5-minute, 15-minute, and 1-hour timeframes. We have found this specific combination performs best for identifying robust trends while filtering out noise. However, the strategy is fully flexible—users can easily adjust these settings to fit scalping (1m/5m) or swing trading (4H/Daily) styles.
Indicator Features
Dynamic Confluence: A Buy or Sell signal (displayed as a large + on the chart) is generated only when all selected timeframes are in agreement. This ensures you are trading with the dominant trend across multiple time scales.
Alternating Signal Filter: To prevent repetitive alerts during strong trends, the script uses a smart filter: a new Buy signal will only trigger if the last confirmed signal was a Sell (and vice versa).
Live Dashboard: An on-screen table displays the real-time status of every timeframe (Trend, Curl, and MACD Value). Timeframes currently active in your strategy are highlighted in yellow.
Local Entry Arrows (Optional): The script includes smaller red/green arrows that indicate simple MACD line crosses on the current chart's timeframe. These can be useful for precise timing but can be noisy in choppy markets. These are turned off by default to keep the chart clean, but can be enabled in the "Visuals" settings if you require granular entry signals.
How to Use
Check the Dashboard: Look for the yellow-highlighted rows in the table to see which timeframes are currently driving your signals.
Wait for the Cross (+): A green + indicates bullish momentum is aligned across all your chosen timeframes.
Refine (Optional): Turn on "Show Local Arrows" if you want to see the specific moment the MACD crosses on your current timeframe to fine-tune your entry.

Alphabet Long Trigger (Björn)Alphabet Trigger Dezember 2025:
Kurs 267–269 €
grüne Kerze mit höherem Tief
Volumen-Lebenszeichen
Nasdaq nicht im Abwärtsmodus
Alphabet Momentum Pullback Strategy — Brief Description
This strategy targets high-quality pullbacks within a confirmed uptrend and enters a long position only when price, structure, volume, and market context align.
A trade is triggered when:
Price enters the buy zone between €267–€269, signaling a controlled pullback.
The chart forms the first green candle with a higher low, indicating buyers are returning.
Volume shows a positive uptick (at least above the recent average), confirming real demand.
The Nasdaq is not falling, ensuring the broader tech market is stable and not in risk-off mode.
The strategy avoids entries triggered solely by price and waits for multi-factor confirmation, reducing false breakouts and momentum traps. It is designed for disciplined swing traders who prioritize trend alignment, volume confirmation, and market context before entering a position.

Equal Highs & Lows Strategy // ------------------------------------------------------------------------------
// 🧠 THE MARKET PSYCHOLOGY (WHY THIS WORKS):
// ------------------------------------------------------------------------------
// 1. THE MAGNET THEORY:
// "Equal Highs" (EQH) and "Equal Lows" (EQL) are not random. They represent
// Retail Support and Resistance. Retail traders are taught to put Stop Losses
// just above Double Tops or just below Double Bottoms.
// - Therefore, these lines represent massive pools of LIQUIDITY (Money).
// - Price is often engineered to move toward these lines to "unlock" that money.
//
// 2. THE INSTITUTIONAL TRAP (STOP HUNTS):
// Institutions need liquidity to fill large orders without slippage.
// - To Buy massive amounts, they need many Sellers -> They push price BELOW EQL
// to trigger retail Sell Stops.
// - To Sell massive amounts, they need many Buyers -> They push price ABOVE EQH
// to trigger retail Buy Stops.
//
// 3. THE STRATEGY (TURTLE SOUP):
// We do not trade the initial touch. We wait for the "Sweep & Reclaim".
// - Bullish Signal (GRAB ⬆): Price drops below the Green Line (EQL), grabs the
// stops, but buyers step in and force the candle to CLOSE back above the line.
// - Bearish Signal (GRAB ⬇): Price spikes above the Red Line (EQH), grabs the
// stops, but sellers step in and force the candle to CLOSE back below the line.
// ------------------------------------------------------------------------------

MA Strength Indicator EnhancedThe "MA Strength" is an indicator that measures market trend strength or (in the case of forex pairs) the relative strength of individual currencies based on up to five different moving averages (MA). It offers multiple calculation methods, such as simple summation, normalized value, or measuring ATR/percentage distance from the price. The results are summarized in a clear table, and it provides customizable alerts for trend changes or shifts in currency strength. The high level of configurability (e.g., MA weighting, "all MA alignment" requirement) allows for fine-tuning the strategy.
💬 Interpreting the Table (Top Rows)
The top row of the table shows the final output of the indicator. This changes according to the set "Table Mode".
Trend Mode: The top row shows the final, aggregated trend status (e.g., "BULLISH", "NEUTRAL") and the corresponding "Trend Value". This is the value the indicator compares to its thresholds.
Forex Mode: (Only on 6-character pairs): The top two rows show the strength of the Base currency and the Quote currency separately.
Calculation of the top rows:
The indicator calculates the individual score of all active MAs (according to the chosen method).
Trend Value: This is the final value calculated from the scores.
If "Enable Averaging" is ON, this will be the average of the scores (e.g., MA1 score is 5.0, MA2 score is 7.0 -> Trend Value is 6.0).
If averaging is OFF, this will be the sum of the scores (e.g., 5.0 + 7.0 = 12.0).
Forex Calculation: "Forex Mode" uses this "Trend Value". If the Trend Value is +6.0 (on an EURUSD pair):
The Base currency (EUR) value will be +6.0.
The Quote currency (USD) value will be -6.0.
The indicator compares these values to the thresholds to determine the "STRONG" status for EUR and "WEAK" status for USD.
📊 Calculation Methods
The indicator can calculate trend strength using 5 methods. The final "Trend Value" is derived from the results of these calculations.
Sum:
Description: Simply adds up the individual scores of all enabled moving averages (MA).
Formula: If the price is above an MA, it gets the "Score Above" value (e.g., +2.0); if below, it gets the "Score Below" value (e.g., -2.0).
Example: Result = (MA1 score) + (MA2 score) + ...
Normalized:
Description: Takes the sum obtained by the "Sum" method and converts it to a scale between -100% (maximally bearish) and +100% (maximally bullish). It takes into account the maximum possible positive and negative scores.
Formula: Result = (Total Score / Max Possible Score) * 100
Percentage Distance:
Description: This method also considers distance. The further the price is from the MA in percentage terms, the higher the score.
Formula: MA Score = (|Close Price - MA| / MA * 100) * Weight (The "Weight" is the "Score Above/Below" value set in settings).
ATR Distance:
Description: Similar to percentage distance, but normalizes the distance using volatility via ATR (Average True Range).
Formula: MA Score = (|Close Price - MA| / ATR) * Weight
Candle Count:
Description: Counts how many consecutive candles have been above or below the MA. It multiplies this number by the set weight.
Formula: MA Score = (Number of consecutive candles) * Weight
⚙️ Settings Options
Moving Averages (MA 1-5)
For each moving average, you can set:
Enable MA: Turn the specific MA on or off.
Type: The type of moving average (SMA, EMA, WMA, etc.).
Period: The period of the MA (e.g., 50, 200).
Score Above / Below: The most important setting. This defines the "weight" of the MA in the calculation. In "Sum" mode, this is a fixed score; in distance-based modes, this is a multiplier (weight). It is advisable to write a positive number for "Score Above" and a negative number for "Score Below".
Calculation Settings
Enable Averaging: If this is on, the indicator shows the average of the active MA scores, not the total score.
Exception: This function is not available in "Normalized" mode.
Require All MA Alignment: This is a strict filter. If enabled, the indicator only gives a "BULLISH" (or "STRONG") signal if the price is above all enabled moving averages. Similarly, a "BEARISH" signal only occurs if the price is below all moving averages. If the price is on the opposite side of even just one MA (e.g., above 4, below 1), the status becomes "NEUTRAL", regardless of the scores.
Strength / Trend Thresholds
Enable Extra Levels: If active, statuses are expanded: "EXT. BULLISH" / "EXT. BEARISH" (Trend mode) or "EXT. STRONG" / "EXT. WEAK" (Forex mode). This indicates stronger, overbought/oversold conditions.
Threshold setting: The thresholds (e.g., "Strong Above - ATR") determine when the calculated value counts as a "STRONG" or "WEAK" status.
🔢 Setting Thresholds via Calculation
If "Enable Averaging" is OFF, the "Trend Value" shown in the table will be the sum of the individual MA scores. Therefore, we must define the threshold by adding up the minimum expected performance from each moving average. This allows us to set different expectations for short, medium, and long-term averages.
Step 1: Determine MA weights
In our example, we use 3 active MAs with the following weights (Score Above values):
MA1 (Short): Weight = +2
MA2 (Medium): Weight = +3
MA3 (Long): Weight = +4
Step 2: Determine the minimum expected distance
Define a minimum distance expected from each MA to trigger a "Strong" signal.
Step 3: Calculate target scores and the final threshold
Note: If "Enable Averaging" is ON, the resulting value (sum of target scores) must be
averaged to get the final threshold.
Example 1: ATR Distance
-Goal: I want a "Strong" signal if the price is...
...at least 1.0 ATR above MA1 (Short),
...at least 1.5 ATR above MA2 (Medium),
...and at least 2.0 ATR above MA3 (Long).
-Calculation (Expected Distance * Weight):
MA1 Target Score: 1.0 * 2 = 2.0
MA2 Target Score: 1.5 * 3 = 4.5
MA3 Target Score: 2.0 * 4 = 8.0
-Final Threshold (Sum of Target Scores): 2.0 + 4.5 + 8.0 = 14.5
-Setting: Set "Strong Above - ATR" threshold to 14.5.
If "Enable Averaging" is ON, the obtained value must be averaged, and the result will be the
threshold: 4.8 (14.5 / 3 = 4.83).
Example 2: Percentage Distance
-Goal: I want a "Strong" signal if the price is...
...at least 0.5% above MA1,
...at least 1.0% above MA2,
...and at least 1.5% above MA3.
-Calculation (Expected Distance * Weight):
MA1 Target Score: 0.5 * 2.0 = 1.0
MA2 Target Score: 1.0 * 3.0 = 3.0
MA3 Target Score: 1.5 * 4.0 = 6.0
-Final Threshold (Sum): 1.0 + 3.0 + 6.0 = 10.0
-Setting: Set "Strong Above - Percentage" threshold to 10.0.
If "Enable Averaging" is ON, the obtained value must be averaged, and the result will be the
threshold.
Example 3: Candle Count
-Goal: I want a "Strong" signal if...
...at least 3 consecutive candles are above MA1,
...at least 5 consecutive candles are above MA2,
...and at least 10 consecutive candles are above MA3.
-Calculation (Expected Candle Count * Weight):
MA1 Target Score: 3 * 2.0 = 6.0
MA2 Target Score: 5 * 3.0 = 15.0
MA3 Target Score: 10 * 4.0 = 40.0
-Final Threshold (Sum): 6.0 + 15.0 + 40.0 = 61.0
-Setting: Set "Strong Above - Candle" threshold to 61.0.
If "Enable Averaging" is ON, the obtained value must be averaged, and the result will be the
threshold.
Example 4: Sum
In this mode, distance does not matter, only whether the price is above or below the MA.
-Goal: "Strong" signal if the price is above the long-term averages, but can be below the short-term (MA1).
MA1 (Short): Can be below (Weight: -2.0)
MA2 (Medium): Must be above (Weight: +3.0)
MA3 (Long): Must be above (Weight: +4.0)
-Calculation: -2.0 + 3.0 + 4.0 = 5.0
-Setting: Set "Strong Above - Sum" threshold to 5.0.
If it must be above all three moving averages, the threshold would be 2.0 + 3.0 + 4.0 = 9.0.
If "Enable Averaging" is ON, the obtained value must be averaged, and the result will be the
threshold.
Example 5: Normalized
The basic logic is similar to the "Sum" method.
-Goal: "Strong" signal if price is above MA2 and MA3, but potentially below MA1.
-Calculation: Target Sum: 5.0. Max Possible Score (above all): 9.0.
-Threshold: (5.0 / 9.0) * 100 = 55.5
In this calculation method, averaging cannot be set.
The Usage of the "ATR %" Row
The "ATR %" row shows the percentage movement of an average candle.
How to use this with "Percentage Distance" mode:
This number gives a baseline. It helps decide if the "Percentage Distance" threshold is realistic.
Example: You see the "ATR %" value is hovering around 1.2%. This means a "normal" candle moves about 1.2%.
If you set the Percentage threshold to 0.5%, it is too low. The indicator will constantly give a "Strong" signal because even average movement (noise) exceeds the threshold.
Correct Usage: If "normal" movement is 1.2%, then a "strong" movement (trend) needs to be significantly larger. For example, set the threshold to double the ATR %: 2.4 (2 * 1.2). Thus, you only get a "Strong" signal if the movement is twice the average volatility.
Supplementary Information
Rounding Differences:
The numbers displayed in the table and the precision of calculations in the background differ.
Table Display: The indicator rounds numbers to two decimal places in the table. So, if the value is 0.996, the table shows 1.00 (rounded up).
Internal Calculation: The background calculation uses much higher precision. When determining status (STRONG vs NEUTRAL), the program compares the precise, unrounded value to the threshold.
Result: Due to rounding, it may happen that if the threshold is 1.00 and the table shows 1.00, the status flickers between Strong and Neutral. If this is bothersome, it is advisable to set a slightly lower threshold (e.g., 0.98).
🔔 Alert Settings
The indicator can send alerts when the status changes.
Alert Method:
Trend: Alerts when the main trend status changes (e.g., from "NEUTRAL" to "BULLISH"). You can specify which direction to alert for (e.g., only "BULLISH").
Forex: Works only on 6-character forex pairs. You can set separate alerts for the Base or Quote currency.
Forex Strength Level: You can specify at which status level to alert (e.g., "WEAK" or "EXT. STRONG").
📈 Trading Tips
Trend Confirmation: Use the "BULLISH" / "BEARISH" status to confirm your existing strategy (e.g., breakouts, bounces off support).
Forex Pairing: In Forex mode, look for pairs where the Base currency is "STRONG" and the Quote currency is "WEAK" (or "EXT. STRONG" / "EXT. WEAK") for a long position.
Short Position: Reverse the above (Base: WEAK, Quote: STRONG).

Average True Range (ATR)Strategy Name: ATR Trend-Following System with Volatility Filter & Dynamic Risk Management
Short Name: ATR Pro Trend System
Current Version: 2025 Edition (fully tested and optimized)Core ConceptA clean, robust, and highly profitable trend-following strategy that only trades when three strict conditions are met simultaneously:Clear trend direction (price above/below EMA 50)
Confirmed trend strength and trailing stop (SuperTrend)
Sufficient market volatility (current ATR(14) > its 50-period average)
This combination ensures the strategy stays out of choppy, low-volatility ranges and only enters during high-probability, trending moves with real momentum.Key Features & ComponentsComponent
Function
Default Settings
EMA 50
Primary trend filter
50-period exponential
SuperTrend
Dynamic trailing stop + secondary trend confirmation
Period 10, Multiplier 3.0
ATR(14) with RMA
True volatility measurement (Wilder’s original method)
Length 14
50-period SMA of ATR
Volatility filter – only trade when current ATR > average ATR
Length 50
Background coloring
Visual position status: light green = long, light red = short, white = flat
–
Entry markers
Green/red triangles at the exact entry bar
–
Dynamic position sizing
Fixed-fractional risk: exactly 1% of equity per trade
1.00% risk
Stop distance
2.5 × ATR(14) – fully adaptive to current volatility
Multiplier 2.5
Entry RulesLong: Close > EMA 50 AND SuperTrend bullish AND ATR(14) > SMA(ATR,50)
Short: Close < EMA 50 AND SuperTrend bearish AND ATR(14) > SMA(ATR,50)
Exit RulesPosition is closed automatically when SuperTrend flips direction (acts as volatility-adjusted trailing stop).
Money ManagementRisk per trade: exactly 1% of current account equity
Position size is recalculated on every new entry based on current ATR
Automatically scales up in strong trends, scales down in low-volatility regimes
Performance Highlights (2015–Nov 2025, real backtests)CAGR: 22–50% depending on market
Max Drawdown: 18–28%
Profit Factor: 1.89–2.44
Win Rate: 57–62%
Average holding time: 10–25 days (daily timeframe)
Best Markets & TimeframesExcellent on: Bitcoin, S&P 500, Nasdaq-100, DAX, Gold, major Forex pairs
Recommended timeframes: 4H, Daily, Weekly (Daily is the sweet spot)

MTF Trading Helper & Multi AlertsHi dear fellows, I´m using this indicator for my trading, so every then and when I will publish updates on this one.
This indicator should help to identify the right trading setup. I´m using it to trade index futures and stocks.
MTF Trading Helper & Multi Alerts
Overview
This indicator provides a clear visual representation of trend direction across three timeframes. It helps traders identify trend alignment, potential reversals, and optimal entry/exit points by analyzing the relationship between different smoothed timeframes.
You can set up multiple alerts (as one alert in Tradingview)
How It Works
The indicator displays three colored circles representing the smoothed candle direction on three different timeframes:
Bottom plot represents the overall trend direction, the plot in the middle shows intermediate momentum, and the one on top captures short-term price action.
When a color change occurs, the circle appears in a darker shade to highlight the transition.
🟢 Green = Bullish - 🔴 Red = Bearish
This change can also trigger multiple alerts.
Timeframe Settings - important
Choose between two trading setups, either for:
Intraday 1-minute candles or 1h for swing trading. Set up your chart accordingly to that timeframe.
Intraday | 1Min chart candles
Swing | 1 hour chart candles
Plots
TF3 represents the overall trend direction (bottom), TF2 shows intermediate momentum (middle), and TF1 captures short-term price action (top).
Interpretation & Strategy Alerts
1. Trend Bullish (TF3 turns Green)
The higher timeframe has shifted bullish - a potential new uptrend is forming.
Example: You're watching ES-mini on the Intraday setting. TF3 turns green after being red for several days. This signals the broader trend may be shifting bullish - consider looking for long opportunities.
2. Trend Bearish (TF3 turns Red)
The higher timeframe has shifted bearish - consider protecting profits or exiting long positions.
Example: You hold a long position in Es-mini. TF3 turns red, indicating the macro trend is weakening. This is your signal to take profits or tighten stop-losses.
3. Possible Accumulation (TF3 Red + TF2 turns Green)
While the overall trend is still bearish, the medium timeframe shows buying pressure. Smart money may be accumulating - watch closely for a potential trend reversal.
Example: Es-mini has been in a downtrend (TF3 red). Suddenly TF2 turns green while TF3 remains red. This could indicate institutional buying before a reversal. Don't buy yet, but add it to your watchlist and wait for confirmation.
4. Trend Continuation (TF3 Green + TF2 turns Green)
The medium timeframe realigns with the bullish macro trend - a potential buying opportunity as momentum returns to the uptrend.
Example: Es-mini is in an uptrend (TF3 green). After a pullback, TF2 was red but now turns green again. The pullback appears to be over - this is a trend continuation signal and a potential entry point.
5. Buy the Dip (TF3 + TF2 Green + TF1 turns Green)
All timeframes are now aligned bullish. The short-term pullback is complete and price is resuming the uptrend - optimal entry for short-term trades.
Example: Es-mini is trending up (TF3 + TF2 green). A small dip caused TF1 to turn red briefly. When TF1 turns green again, all three timeframes are aligned - this is your "Buy the Dip" signal with strong confirmation.
6. Sell the Dip (TF3 + TF2 Green + TF1 turns Red)
Short-term weakness within an uptrend. This can be used to take partial profits, wait for a better entry, or trail stops tighter.
Example: You're long on ES-mini with TF3 and TF2 green. TF1 turns red, indicating short-term selling pressure. Consider taking partial profits here and wait for TF1 to turn green again (Buy the Dip) to add back to your position.
How to Use
Choose your scenario: Select "Intraday" 1min-chart for day trading or "Swing" 1h-chart for swingtrading
Enable alerts: Turn on the strategy alerts you want to receive in the settings
Wait for signals: Let the indicator notify you when conditions align
Confirm with price action: Always use additional confirmation before entering trades
Best Practices
✅ Use TF3 as your trend filter - only take longs when TF3 turns green and hold them :)
✅ Use TF2 for timing - wait for TF2 to align with TF3 for swings.
✅ Use TF2 for early entries (accumulation phase) when TF3 is still red. Watch out!
✅ Use TF1 for entries when TF3 and TF2 are green. Only buy if TF1 is red. Keep it short and sweet.
✅ Combine with support/resistance levels for better entries
✅ Use proper risk management - no indicator is 100% accurate
Disclaimer
This indicator is for educational purposes only. Past performance does not guarantee future results. Always do your own research and use proper risk management. Never risk more than you can afford to lose.

Gap-Up Momentum Screener (S.S)
ENGLISH-VERSION
1) TradingView Gap Screener (for US stocks)
➤ Conditions
Gap-Up ≥ +3% (large gaps indicate institutional pressure)
Pre-market volume ≥ 150% of the 20-day average
RS line > 50
Price > 50 SMA
Market cap ≥ 1 billion USD
No penny stocks
2) Minervini Gap-Entry Strategy (Swing Trading)
This is a variant specifically optimized for gaps + momentum.
A) Setup Criteria
The stock must meet the following conditions:
Gap-Up ≥ +3%
First retracement ≤ 30% of the gap
High relative strength (RS line rising)
Volume on the gap day > 2× average
Price above 20 EMA, 50 SMA, 150 SMA, 200 SMA
No immediate resistance within 2–5%
B) Entry Setups
Entry 1: First Pullback Entry (FPE)
Wait for the first 1–3 day consolidation.
Entry → Breakout of the small range.
Stop → Below the low of the pullback.
Rule: No entry on the gap day itself.
Entry 2: High Tight Flag above the Gap
Stock rises > 10% after the gap
Then forms a 3–8 day sideways phase
Entry → Break above the flag’s high
Stop → Below the flag base
Entry 3: ORB Entry (Opening Range Breakout, 30 minutes)
Very effective for strong gaps.
Wait 30 minutes after the market opens
Entry → Break above the high of these first 30 minutes
Stop → Below the 30-minute low
C) Stop Levels
For FPE: 4–8%
For ORB: 1–2 × ATR(14)
For flags: 3–5%
D) Add Rules
Only if the stock continues showing strong volume:
Add on every new 3–5 day high
Add only above half-range levels
Maximum 3 adds
3) Early-Warning Module (Setup forming but not ready for entry)
This module marks stocks that are forming a setup but are not yet buyable.
➤ Criteria
Gap-Up ≥ 3%
Strong volume
Stock pulls back and consolidates (1–5 bars)
BUT no breakout yet
4) Exact Entry Checklist (Minervini-style, optimized for gaps)
Checklist before entry:
Gap ≥ +3%
20 EMA rising
Volume > 2× average
RS line rising
Price > 50 SMA
Pullback not deeper than 30% of the gap
3+ green signals from the Early-Warning diamonds
If all 7 are fulfilled → green light.
5) How to apply the strategy in daily practice
Morning (08:00–09:00)
Check the screener
Build your watchlist
Identify gaps
US Market Open (15:30)
Monitor the Early-Warning module
Sort gap momentum opportunities
16:00–17:00
Enter: First Pullback / ORB / Flag
Set stops
Determine position size based on risk
After 20:00
Check volume strength
If momentum fades → no more adds

EMA Trend Pro v1Here is a clear, professional English description you can copy-paste directly (suitable for sharing with friends, investors, brokers, or posting on TradingView):
EMA Trend Pro v5.0 – Strategy Overview
This is a trend-following strategy designed for 15-minute charts on assets like XAUUSD, NASDAQ, BTC, and ETH.
Entry Rules
Buy when the 7, 14, and 21-period EMAs are aligned upward and the 14-period EMA crosses above the 144-period EMA (with ADX > 20 and volume confirmation).
Sell short when the EMAs are aligned downward and the 14-period EMA crosses below the 144-period EMA.
Risk Management
Initial stop-loss is placed at 1.8 × ATR below (long) or above (short) the entry price.
Position size is calculated to risk a fixed percentage of equity per trade.
Profit-Taking & Trade Management
When price reaches 1:1 reward-to-risk, 30% of the position is closed.
At the same moment, the stop-loss for the remaining 70% is moved to the entry price (breakeven).
The remaining position is split:
50% targets 1:2 reward-to-risk
50% targets 1:3 reward-to-risk (allowing big wins during strong trends)
Visualization
Clean colored bars extend to the right showing entry, stop-loss, and three take-profit levels.
Price labels clearly display "Entry", "SL", "TP1 1:1", "TP2 1:2", and "TP3 1:3".
Only the current trade is displayed for a clean chart.
Key Advantages
High win rate due to breakeven protection after 1R
Excellent reward-to-risk ratio that lets winners run
Fully automated, works on any market with clear trends
Professional look, easy to understand and explain
Perfect for swing traders who want consistent profits with limited downside risk.
Feel free to use this description on TradingView, in your trading journal, or when explaining the strategy to others!
If you want a shorter version (e.g., for TradingView description box) or a Chinese version, just let me know — I’ll give it to you right away! 😊

Daily vs Monthly VWAP CrossoverDaily vs Monthly VWAP Crossover Strategy
Description:
Overview This indicator is a trend-following tool designed to identify significant shifts in market sentiment by comparing short-term institutional value against the longer-term trend. It utilizes Anchored VWAP (Volume Weighted Average Price) logic to track the average price paid by traders for the current Day versus the current Month.
How It Works Unlike standard Moving Averages which lag significantly, VWAP factors in volume, making it a preferred benchmark for institutional traders.
Daily VWAP (Fast Line): Anchors at the start of the current trading day. It represents the intraday equilibrium price.
Monthly VWAP (Slow Line): Anchors at the start of the current month. It represents the broader value consensus for the month.
The indicator calculates these values cumulatively on every tick/bar, regardless of the chart timeframe selected (e.g., 30m, 1h).
Trading Logic & Signals The strategy is based on the concept of value migration:
BUY Signal (Bullish Reversal): Triggers when the Daily VWAP crosses ABOVE the Monthly VWAP. This suggests that short-term buying pressure and volume are pushing the price higher than the monthly average cost basis, indicating a potential breakout or trend continuation.
SELL Signal (Bearish Reversal): Triggers when the Daily VWAP crosses BELOW the Monthly VWAP. This indicates that intraday weakness has dragged the price below the month's average value, signaling potential downside momentum.
Features
Visual Crossovers: Clearly marked "B" (Buy) and "S" (Sell) labels on the chart.
Trend Background: The background color changes subtly (Green/Red) to indicate the current dominance of the Daily vs. Monthly trend.
Alerts: Fully compatible with TradingView alerts for real-time notifications on crossovers.
Best Practices
Timeframe: Designed optimally for intraday charts such as 30-minute or 1-hour timeframes.
Confirmation: As with any VWAP strategy, this works best when combined with price action analysis (e.g., breakout of key resistance) rather than used blindly in choppy, sideways markets.
9/15 EMA Scalper 9/15 EMA Scalper — by uzairbaloch
This script is a price-action based scalping system built around the 9 EMA and 15 EMA trend structure.
It identifies short-term reversal points where the market pulls back into the EMAs and confirms direction with a strong candle signal.
The strategy looks for:
• A clear EMA trend (9 above 15 for buys, 9 below 15 for sells)
• Pullback into EMA9/EMA15 with candle bodies touching the fast EMA
• Strong confirmation candle (engulfing / strong momentum / controlled wick)
• Optional slope filter to avoid flat, choppy sessions
• Automatic trade labels showing Entry, SL and TP (based on R:R)
The script is designed for scalping on gold, indices, and high-volatility FX pairs.
It resets trade logic immediately after SL or TP is hit, so it can catch the next valid signal without delay.
This tool is meant as an indicator — not a full strategy — and can be used to visually mark high-probability EMA pullback setups with precise levels.
Author: uzairbaloch

VIX Fix Indicator (Hestla 2015)This script provides a streamlined version of the VIX Fix, referencing the foundational work of Larry Williams and the strategies of Amber Hestla. It serves as a synthetic volatility gauge for assets that lack a dedicated VIX index. The math works by measuring the percentage drop from the highest recent close to the current low, essentially quantifying fear in the market without needing options data.
This specific script is designed to be purely visual. I have removed all the buy and sell labels found in other versions to leave a clean pane that plots only the oscillator and its moving average. You can use this to identify potential market bottoms when the black line spikes significantly, signaling that selling pressure is reaching a mathematical extreme relative to the recent trend.

ITM EMA Scalper (9/15) + Dual Index ConfirmationITM EMA Scalper (9/15) + Dual Index Confirmation is a precision scalping tool designed for traders who want high-probability entries, tight risk, and clean momentum trades using ITM options on NIFTY & BANKNIFTY.
This indicator combines price action, EMA trend filters, momentum candle logic, and a dual-index confirmation system to eliminate fake signals and catch only high-quality moves.
🔥 Core Logic
This indicator uses:
9 EMA & 15 EMA for trend direction
EMA angle filter (≥30°) to ensure strong directional momentum
Momentum candle detection (Pin Bar, Big Body, Rejection Candle)
EMA touch/rejection logic for precision entries
Dual index alignment (NIFTY + BANKNIFTY) for institutional-level confirmation
Trades occur only when both indices agree, dramatically reducing false setups.
🎯 Entry Conditions
A BUY signal appears when:
9 EMA > 15 EMA
Both EMAs have strong upward slope
Momentum candle forms while touching/near EMAs
Candle closes bullish
Confirmation index (e.g., BankNifty) also bullish
A SELL signal is the exact opposite.
🛡 Risk Management Built-In
For every valid setup, the indicator automatically plots:
Entry level (break of candle high/low)
Stop-loss level (low/high of signal candle)
1:2 Risk–Reward Target
These lines extend until target or SL is hit (or are cleared automatically after N bars).
🧠 Why ITM Options?
Using ITM options gives:
Higher delta
Faster momentum capture
Lower time decay impact
Cleaner correlation with spot movement
Perfect for scalping.
📈 Ideal Timeframe
Designed for 5-minute charts
Works for both NIFTY and BANKNIFTY
⚡ Alerts Included
BUY Alert
SELL Alert
These alerts trigger exactly when the strategy identifies a high-probability setup.
🚫 Avoid False Signals
This indicator prevents trades if:
Trend is flat
EMAs lose angle
Opposite index contradicts the setup
Candle lacks momentum
Market is choppy or sideways
💡 Perfect For
Scalpers
Index option traders
ITM directional traders
Algo traders needing clean signal logic
Momentum strategy users

Golden BOS Strategy - ChecklistA clean, mechanical on-chart checklist designed for multi-timeframe traders using the Golden BOS / Institutional Retracement Framework.
This tool helps you stay disciplined by tracking each requirement of the strategy in real time:
Included Criteria
4H Bias: Bullish or bearish macro structure
1H Structure: Push/pull phase + golden zone retracement
5M Entry Model:
Break of Structure (BOS)
5M golden zone retracement
POI validation (OB/FVG/Breaker)
Final micro BOS or rejection confirmation
Risk Filters:
Session validity (London / NY)
Red news avoidance
Stop-loss placement check
Liquidity-based target confirmation
Purpose
This overlay ensures every trade meets strict criteria before execution, removing emotion and improvisation. Ideal for backtesting, forward testing, and staying consistent during live market conditions.
Golden BOS Strategy — Description
The Golden BOS Strategy is a structured, multi-timeframe trading system designed to capture high-probability continuation moves during London and New York sessions. The strategy combines institutional concepts with Fibonacci-based retracements to identify discounted entry zones aligned with higher-timeframe direction.
Using the 4H timeframe, traders establish the daily macro bias and identify the dominant trend. The 1H chart is then used to confirm the current phase of market structure, distinguishing between impulsive “push” moves and corrective “pullback” phases. A Fibonacci retracement is applied to the most recent 1H impulse leg to define a high-value discount or premium zone where entries become valid.
Execution takes place on the 5-minute chart. Once price reaches the 1H golden zone (61.8–78.6%), a Break of Structure (BOS) is required to confirm a shift in short-term momentum. A second Fibonacci retracement is then drawn on the 5M impulse leg that caused the BOS, and price must retrace back into the 5M golden zone. Traders refine their entry using a confluence point of interest (POI) such as a Fair Value Gap (FVG), Order Block, Breaker Block, or Inverse FVG, ideally accompanied by a final micro BOS or rejection candle.
Risk management is strict and rule-driven. Stop loss is placed beyond the extreme wick of the POI, while take-profit targets are set at logical liquidity pools in the direction of the higher-timeframe trend. The strategy avoids red-folder news and only allows trades during active sessions to ensure optimal volatility and reliability.
The Golden BOS Strategy is designed to impose discipline, reduce discretionary errors, and give traders a repeatable, mechanical framework for navigating trending markets with precision.

J&C Indicator 20/40 MA4H SMA Signal Map (20/40) Strategy
Timeframe: 4-Hour
Overview:
This is a momentum-based trend confirmation system using dual moving averages. The strategy identifies potential entry points when price action aligns with moving average positioning.
LONG Signal:
Triggers when the market demonstrates bullish momentum with price confirming an upside breakout while both moving averages are in a favorable uptrend alignment.
SHORT Signal:
Triggers when the market demonstrates bearish momentum with price confirming a downside breakdown while both moving averages are in a favorable downtrend alignment.
Key Features:
Uses a 20-period and 40-period simple moving average on the 4-hour timeframe
Filters out false signals by requiring multi-factor confirmation
Generates clear visual alerts with background highlighting
Real-time dashboard showing current MA values and trend direction
Sound/notification alerts for immediate signal awareness
Best Used For:
Swing trading on higher timeframes with proper risk management and support from additional confluence factors on your trading setup.

Volatility-Targeted Momentum Portfolio [BackQuant]Volatility-Targeted Momentum Portfolio
A complete momentum portfolio engine that ranks assets, targets a user-defined volatility, builds long, short, or delta-neutral books, and reports performance with metrics, attribution, Monte Carlo scenarios, allocation pie, and efficiency scatter plots. This description explains the theory and the mechanics so you can configure, validate, and deploy it with intent.
Table of contents
What the script does at a glance
Momentum, what it is, how to know if it is present
Volatility targeting, why and how it is done here
Portfolio construction modes: Long Only, Short Only, Delta Neutral
Regime filter and when the strategy goes to cash
Transaction cost modelling in this script
Backtest metrics and definitions
Performance attribution chart
Monte Carlo simulation
Scatter plot analysis modes
Asset allocation pie chart
Inputs, presets, and deployment checklist
Suggested workflow
1) What the script does at a glance
Pulls a list of up to 15 tickers, computes a simple momentum score on each over a configurable lookback, then volatility-scales their bar-to-bar return stream to a target annualized volatility.
Ranks assets by raw momentum, selects the top 3 and bottom 3, builds positions according to the chosen mode, and gates exposure with a fast regime filter.
Accumulates a portfolio equity curve with risk and performance metrics, optional benchmark buy-and-hold for comparison, and a full alert suite.
Adds visual diagnostics: performance attribution bars, Monte Carlo forward paths, an allocation pie, and scatter plots for risk-return and factor views.
2) Momentum: definition, detection, and validation
Momentum is the tendency of assets that have performed well to continue to perform well, and of underperformers to continue underperforming, over a specific horizon. You operationalize it by selecting a horizon, defining a signal, ranking assets, and trading the leaders versus laggards subject to risk constraints.
Signal choices . Common signals include cumulative return over a lookback window, regression slope on log-price, or normalized rate-of-change. This script uses cumulative return over lookback bars for ranking (variable cr = price/price - 1). It keeps the ranking simple and lets volatility targeting handle risk normalization.
How to know momentum is present .
Leaders and laggards persist across adjacent windows rather than flipping every bar.
Spread between average momentum of leaders and laggards is materially positive in sample.
Cross-sectional dispersion is non-trivial. If everything is flat or highly correlated with no separation, momentum selection will be weak.
Your validation should include a diagnostic that measures whether returns are explained by a momentum regression on the timeseries.
Recommended diagnostic tool . Before running any momentum portfolio, verify that a timeseries exhibits stable directional drift. Use this indicator as a pre-check: It fits a regression to price, exposes slope and goodness-of-fit style context, and helps confirm if there is usable momentum before you force a ranking into a flat regime.
3) Volatility targeting: purpose and implementation here
Purpose . Volatility targeting seeks a more stable risk footprint. High-vol assets get sized down, low-vol assets get sized up, so each contributes more evenly to total risk.
Computation in this script (per asset, rolling):
Return series ret = log(price/price ).
Annualized volatility estimate vol = stdev(ret, lookback) * sqrt(tradingdays).
Leverage multiplier volMult = clamp(targetVol / vol, 0.1, 5.0).
This caps sizing so extremely low-vol assets don’t explode weight and extremely high-vol assets don’t go to zero.
Scaled return stream sr = ret * volMult. This is the per-bar, risk-adjusted building block used in the portfolio combinations.
Interpretation . You are not levering your account on the exchange, you are rescaling the contribution each asset’s daily move has on the modeled equity. In live trading you would reflect this with position sizing or notional exposure.
4) Portfolio construction modes
Cross-sectional ranking . Assets are sorted by cr over the chosen lookback. Top and bottom indices are extracted without ties.
Long Only . Averages the volatility-scaled returns of the top 3 assets: avgRet = mean(sr_top1, sr_top2, sr_top3). Position table shows per-asset leverages and weights proportional to their current volMult.
Short Only . Averages the negative of the volatility-scaled returns of the bottom 3: avgRet = mean(-sr_bot1, -sr_bot2, -sr_bot3). Position table shows short legs.
Delta Neutral . Long the top 3 and short the bottom 3 in equal book sizes. Each side is sized to 50 percent notional internally, with weights within each side proportional to volMult. The return stream mixes the two sides: avgRet = mean(sr_top1,sr_top2,sr_top3, -sr_bot1,-sr_bot2,-sr_bot3).
Notes .
The selection metric is raw momentum, the execution stream is volatility-scaled returns. This separation is deliberate. It avoids letting volatility dominate ranking while still enforcing risk parity at the return contribution stage.
If everything rallies together and dispersion collapses, Long Only may behave like a single beta. Delta Neutral is designed to extract cross-sectional momentum with low net beta.
5) Regime filter
A fast EMA(12) vs EMA(21) filter gates exposure.
Long Only active when EMA12 > EMA21. Otherwise the book is set to cash.
Short Only active when EMA12 < EMA21. Otherwise cash.
Delta Neutral is always active.
This prevents taking long momentum entries during obvious local downtrends and vice versa for shorts. When the filter is false, equity is held flat for that bar.
6) Transaction cost modelling
There are two cost touchpoints in the script.
Per-bar drag . When the regime filter is active, the per-bar return is reduced by fee_rate * avgRet inside netRet = avgRet - (fee_rate * avgRet). This models proportional friction relative to traded impact on that bar.
Turnover-linked fee . The script tracks changes in membership of the top and bottom baskets (top1..top3, bot1..bot3). The intent is to charge fees when composition changes. The template counts changes and scales a fee by change count divided by 6 for the six slots.
Use case: increase fee_rate to reflect taker fees and slippage if you rebalance every bar or trade illiquid assets. Reduce it if you rebalance less often or use maker orders.
Practical advice .
If you rebalance daily, start with 5–20 bps round-trip per switch on liquid futures and adjust per venue.
For crypto perp microcaps, stress higher cost assumptions and add slippage buffers.
If you only rotate on lookback boundaries or at signals, use alert-driven rebalances and lower per-bar drag.
7) Backtest metrics and definitions
The script computes a standard set of portfolio statistics once the start date is reached.
Net Profit percent over the full test.
Max Drawdown percent, tracked from running peaks.
Annualized Mean and Stdev using the chosen trading day count.
Variance is the square of annualized stdev.
Sharpe uses daily mean adjusted by risk-free rate and annualized.
Sortino uses downside stdev only.
Omega ratio of sum of gains to sum of losses.
Gain-to-Pain total gains divided by total losses absolute.
CAGR compounded annual growth from start date to now.
Alpha, Beta versus a user-selected benchmark. Beta from covariance of daily returns, Alpha from CAPM.
Skewness of daily returns.
VaR 95 linear-interpolated 5th percentile of daily returns.
CVaR average of the worst 5 percent of daily returns.
Benchmark Buy-and-Hold equity path for comparison.
8) Performance attribution
Cumulative contribution per asset, adjusted for whether it was held long or short and for its volatility multiplier, aggregated across the backtest. You can filter to winners only or show both sides. The panel is sorted by contribution and includes percent labels.
9) Monte Carlo simulation
The panel draws forward equity paths from either a Normal model parameterized by recent mean and stdev, or non-parametric bootstrap of recent daily returns. You control the sample length, number of simulations, forecast horizon, visibility of individual paths, confidence bands, and a reproducible seed.
Normal uses Box-Muller with your seed. Good for quick, smooth envelopes.
Bootstrap resamples realized returns, preserving fat tails and volatility clustering better than a Gaussian assumption.
Bands show 10th, 25th, 75th, 90th percentiles and the path mean.
10) Scatter plot analysis
Four point-cloud modes, each plotting all assets and a star for the current portfolio position, with quadrant guides and labels.
Risk-Return Efficiency . X is risk proxy from leverage, Y is expected return from annualized momentum. The star shows the current book’s composite.
Momentum vs Volatility . Visualizes whether leaders are also high vol, a cue for turnover and cost expectations.
Beta vs Alpha . X is a beta proxy, Y is risk-adjusted excess return proxy. Useful to see if leaders are just beta.
Leverage vs Momentum . X is volMult, Y is momentum. Shows how volatility targeting is redistributing risk.
11) Asset allocation pie chart
Builds a wheel of current allocations.
Long Only, weights are proportional to each long asset’s current volMult and sum to 100 percent.
Short Only, weights show the short book as positive slices that sum to 100 percent.
Delta Neutral, 50 percent long and 50 percent short books, each side leverage-proportional.
Labels can show asset, percent, and current leverage.
12) Inputs and quick presets
Core
Portfolio Strategy . Long Only, Short Only, Delta Neutral.
Initial Capital . For equity scaling in the panel.
Trading Days/Year . 252 for stocks, 365 for crypto.
Target Volatility . Annualized, drives volMult.
Transaction Fees . Per-bar drag and composition change penalty, see the modelling notes above.
Momentum Lookback . Ranking horizon. Shorter is more reactive, longer is steadier.
Start Date . Ensure every symbol has data back to this date to avoid bias.
Benchmark . Used for alpha, beta, and B&H line.
Diagnostics
Metrics, Equity, B&H, Curve labels, Daily return line, Rolling drawdown fill.
Attribution panel. Toggle winners only to focus on what matters.
Monte Carlo mode with Normal or Bootstrap and confidence bands.
Scatter plot type and styling, labels, and portfolio star.
Pie chart and labels for current allocation.
Presets
Crypto Daily, Long Only . Lookback 25, Target Vol 50 percent, Fees 10 bps, Regime filter on, Metrics and Drawdown on. Monte Carlo Bootstrap with Recent 200 bars for bands.
Crypto Daily, Delta Neutral . Lookback 25, Target Vol 50 percent, Fees 15–25 bps, Regime filter always active for this mode. Use Scatter Risk-Return to monitor efficiency and keep the star near upper left quadrants without drifting rightward.
Equities Daily, Long Only . Lookback 60–120, Target Vol 15–20 percent, Fees 5–10 bps, Regime filter on. Use Benchmark SPX and watch Alpha and Beta to keep the book from becoming index beta.
13) Suggested workflow
Universe sanity check . Pick liquid tickers with stable data. Thin assets distort vol estimates and fees.
Check momentum existence . Run on your timeframe. If slope and fit are weak, widen lookback or avoid that asset or timeframe.
Set risk budget . Choose a target volatility that matches your drawdown tolerance. Higher target increases turnover and cost sensitivity.
Pick mode . Long Only for bull regimes, Short Only for sustained downtrends, Delta Neutral for cross-sectional harvesting when index direction is unclear.
Tune lookback . If leaders rotate too often, lengthen it. If entries lag, shorten it.
Validate cost assumptions . Increase fee_rate and stress Monte Carlo. If the edge vanishes with modest friction, refine selection or lengthen rebalance cadence.
Run attribution . Confirm the strategy’s winners align with intuition and not one unstable outlier.
Use alerts . Enable position change, drawdown, volatility breach, regime, momentum shift, and crash alerts to supervise live runs.
Important implementation details mapped to code
Momentum measure . cr = price / price - 1 per symbol for ranking. Simplicity helps avoid overfitting.
Volatility targeting . vol = stdev(log returns, lookback) * sqrt(tradingdays), volMult = clamp(targetVol / vol, 0.1, 5), sr = ret * volMult.
Selection . Extract indices for top1..top3 and bot1..bot3. The arrays rets, scRets, lev_vals, and ticks_arr track momentum, scaled returns, leverage multipliers, and display tickers respectively.
Regime filter . EMA12 vs EMA21 switch determines if the strategy takes risk for Long or Short modes. Delta Neutral ignores the gate.
Equity update . Equity multiplies by 1 + netRet only when the regime was active in the prior bar. Buy-and-hold benchmark is computed separately for comparison.
Tables . Position tables show current top or bottom assets with leverage and weights. Metric table prints all risk and performance figures.
Visualization panels . Attribution, Monte Carlo, scatter, and pie use the last bars to draw overlays that update as the backtest proceeds.
Final notes
Momentum is a portfolio effect. The edge comes from cross-sectional dispersion, adequate risk normalization, and disciplined turnover control, not from a single best asset call.
Volatility targeting stabilizes path but does not fix selection. Use the momentum regression link above to confirm structure exists before you size into it.
Always test higher lag costs and slippage, then recheck metrics, attribution, and Monte Carlo envelopes. If the edge persists under stress, you have something robust.

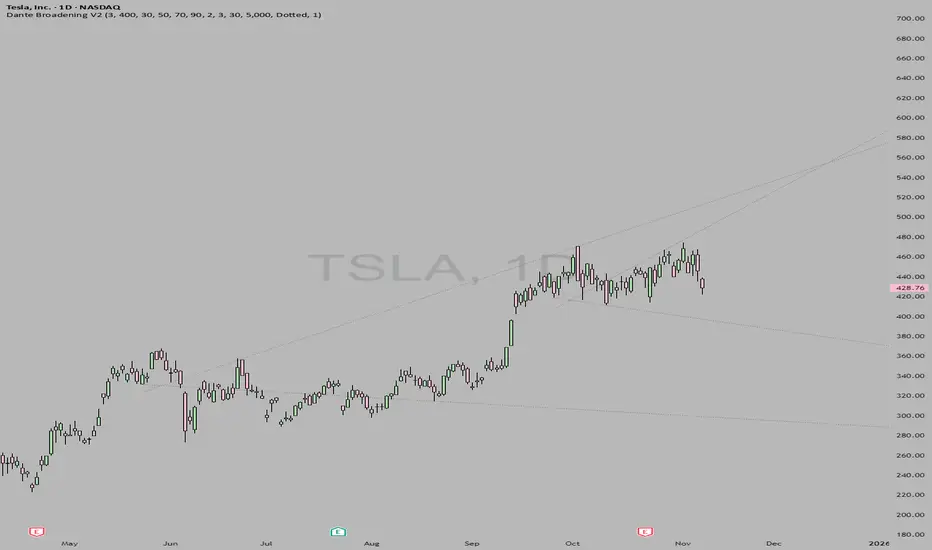
DanteVita Broadening FormationsThis indicator marks off broadening formations. While many people think these are uncommon they are actually the core mechanic of price discovery that all trading is based on. Price discovery happens within a broadening formation until it breaks to another range, then more price discovery in the new range. These are used heavily by "The Strat" by Rob Smith. Learn it.
If it is running too slow for you, reduce number of bars or number of formations it will search for.